| Land Registry data | November av.price | Monthly change | 12 Month change |
| England | £234,278 | +0.1% | +7.2% |
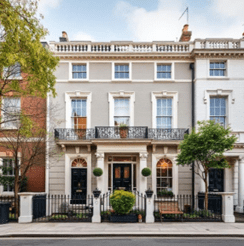
| London | £481,648 | +1.7% | +7.7% |
| Royal Borough of Kensington and Chelsea | £1,303,778 | +6.9% | +0.7% |
| City of Westminster | £1,021,027 | +8.1% | +0.8% |
- London’s annual price increase remains strong at 7.7%. The monthly move was of 1.7%.
- Kensington and Chelsea show signs of recovery with a substantial movement in November, and an annual increase of 0.7%.
- The average annual property price in Camden increased by 6.8% and now stands at £872,390.
Bromley was the London borough that recorded the highest number of sales in September 2016 with 338 transactions. - November data shows an annual price increase of 7.2% taking the average property value in England to £234,278.
- Barking and Dagenham is the London borough with the highest annual price rise with a movement of 17%.